

Most B2B buyers have made up their minds about the market before they speak to anyone in it.
In 6sense's 2025 survey of nearly 4,000 B2B buyers, people first contacted a seller about 61% of the way through their buying journey. They usually picked the winner from the shortlist they'd drawn up on day one. So your buyers already carry a map of your market in their heads. You just haven't seen it.
A market positioning map is how you draw that picture on paper, on purpose, with evidence. I'd treat it as a working tool for a leadership team, rather than a slide. Done properly, it shows you who buyers really compare you with, where the market is crowded, and whether the gap you've spotted is a real opening or a trap.
What a Market Positioning Map Is
A market positioning map, also called a perceptual map, is a two-axis chart. Each axis is an attribute buyers use to choose between options. Each point is an alternative they could pick, including options that aren't companies at all.
The chart isn't the point. The conversation it forces is. Where do we really stand? Who's crowded into the same corner? Is there a position nobody holds that buyers would actually pay for?
It helps to be clear about what positioning means before you draw anything. April Dunford, who wrote the positioning book Obviously Awesome, defines it on her own site like this: "Positioning defines how our product is different and better than alternatives for a particular set of customers." Notice the last part. A map is always drawn for a particular set of customers. Change the buyer and the map changes too.
Here's what one looks like. The market is invented, so you can see the method without anyone's real data getting in the way.
Three providers huddle in the generalist, self-serve corner. One managed generalist sits above them. One specialist sells self-serve. Nobody offers a specialist, fully managed service. That empty corner is where most teams get excited, and where the careful work starts.
Why Your Buyers Already Have a Map
Buyers sort the market themselves, mostly without you in the room. That's the main reason to draw your own map: you want to see what they see.
The numbers on this are striking. 6sense's 2025 B2B Buyer Experience Report surveyed just under 4,000 buyers across North America, Europe and Asia-Pacific, with 20% from the UK and Ireland. Buyers evaluated about five vendors on average. They'd filled about four shortlist spots on day one, and they bought from that day-one shortlist 95% of the time.
| Point in the buying journey when buyers first contacted a seller | 61% |
|---|---|
| Buyers whose first vendor conversation was with the eventual winner | 77% |
| Purchases made from the shortlist buyers drew up on day one | 95% |
Source: 6sense, The B2B Buyer Experience Report for 2025, 2025. Vendor-run survey of just under 4,000 buyers. Treat it as directional. Chart by ThriveFinity.
Gartner's research points the same way. In a Gartner survey of 632 B2B buyers (run August to September 2024, published June 2025), 61% said they'd prefer a buying experience with no sales rep at all. If buyers would rather work it out alone, the picture they build comes from your website, your competitors' websites, reviews, peers and AI tools. Your map should be drawn from the same material.
None of this makes a positioning map magic. It does make it urgent. If you're not on the day-one shortlist, a brilliant sales call later won't get you on it.
Start With the Real Alternatives, Not Your Favourite Rival
The first job is listing what buyers actually compare you with. That list is usually longer and stranger than the one in your board deck.
It should include named competitors, of course. But it should also include doing nothing, doing it in-house with a spreadsheet, hiring a generalist the buyer already uses, and these days, possibly asking an AI tool to do a rough version. Dunford calls these "competitive alternatives", and she argues they're where positioning should start. In this episode of her podcast she explains why sales teams are the most reliable source for spotting them. The clip starts at that point.
Here's a test I like. Take your last ten lost deals and write down where each buyer went instead. If "stayed with what they had" appears three times, it belongs on your map as a point, with its own position.
Getting this wrong confuses buyers before it confuses you. This product marketer was analysing a well-known software company and couldn't work out which market it was even in:
The issue is that I am not sure who to compare Front to, at least without a full exploration. Should I evaluate them against Slack since they’re a modern workplace communication platform, or are they more like HelpScout & Zendesk, based on their customer experience messaging?
That's one person's reading, and an old post. The point holds, though. If a professional can't tell who you compete with, a busy buyer will just guess.
Choosing Axes Buyers Actually Care About
Most positioning maps fail at the axes. "Quality" and "innovation" sound important, but every competitor claims to be high on both, so the map shows nothing.
Good axes come from buyers, not from your marketing. Look for the attributes people mention in sales calls, lost-deal notes and reviews. Each axis should split the market, with real alternatives at both ends. The two axes shouldn't measure the same thing (price and service level often move together, so they make a poor pair). And you need to be able to place every alternative from something checkable.
If you're stuck for candidates, Bain's research is a useful prompt. In The B2B Elements of Value (Harvard Business Review, 2018), Eric Almquist, Jamie Cleghorn and Lori Sherer describe 40 "elements of value" that B2B buyers weigh, in five groups: table stakes, functional, ease of doing business, individual and inspirational. I'd look first at the ease-of-doing-business and individual groups. Think of things like how much effort the buyer has to put in, or how safe the choice feels for the person signing.
| Axis pair | Works when buyers say things like | Evidence to plot it |
|---|---|---|
| Generalist vs sector specialist | "Have you worked with firms like us?" | Case studies, client lists, sector pages |
| Self-serve vs fully managed | "Who actually does the work?" | Product pages, onboarding steps, published scope |
| Fixed price vs time-based | "What will this cost us in the end?" | Pricing pages, published terms |
| Speed vs depth | "How soon can we have it?" | Stated delivery times, review comments |
| Small-company vs enterprise focus | "Is this built for a business our size?" | Minimum contract sizes, logos, job adverts |
Try two or three pairs. Keep the one that separates the alternatives most clearly. And watch out for the single-axis trap, where a team only ever looks at price. One product marketer described exactly that at a large company:
In the big corporate org I work for (many portfolios of many product lines, global B2B B2C distribution), the business leaders who set the strategy look at our target market almost exclusively though a price scale within the category
Their worry was that a price-only view leads to "marginally better" copies of what's already out there. A second axis that buyers care about is how you get out of that loop.
Plotting Competitors From Evidence
Place each alternative using sources you could show a sceptic, and write the source and date beside every point. If you can't, the point is a guess, and you should mark it as one.
The useful sources are mostly public. Pricing and product pages, published terms, case studies, review sites, job adverts and what buyers told you on calls. For UK competitors, Companies House lets you see company details, officers and filed documents for free, which helps when you're placing someone on a size or focus axis. To see how a competitor has moved over time, the Internet Archive's Wayback Machine keeps earlier versions of many public pages. It won't have everything. Its own help page says it doesn't archive pages behind a password, and some sites are excluded.
The sources and the legal limits in our competitive intelligence guide apply here too. Stick to public or properly obtained information. If you want a structured way to gather it, the free competitive intelligence audit checklist covers 23 checks in one sitting.
Then plot yourself, honestly. Where would buyers put you today? That's often not where you'd like to be. If those two places differ, the difference is your positioning work.
One more caution if the map is going anywhere public, like your website or a sales deck. A map that names competitors is a comparison. The UK's CAP Code says comparisons with an identifiable competitor must compare products "meeting the same needs or intended for the same purpose" and must "objectively compare one or more material, relevant, verifiable and representative feature". Keep your evidence file. Internal maps can be rougher.
Reading the Map: Crowded, Empty, and Empty for a Reason
Once the points are on, every area of the map falls into one of three types. Each needs a different response.
- Crowded. Several alternatives in one area. Competing there means competing on price or execution, unless you can show a clear difference buyers care about.
- Empty. An area nobody occupies. In the example, specialist and fully managed is empty. At this stage that's a hypothesis.
- Empty for a reason. Often a gap is empty because buyers don't want it, won't pay for it, or it can't be delivered profitably.
An empty space on a map is a question, and you need buyer evidence to answer it. To test a gap, ask five to eight target buyers whether they'd value that combination and what they'd pay. Check whether any provider tried it and stopped (the Wayback Machine is handy here). Then work out, honestly, if you could deliver it at that price.
If you're not sure the gap is real, that's normal. A market validation pass is the right next step before you rebuild anything around it.
Turning the Map Into a Positioning Decision
A map is an input to a decision. The decision is the position you choose to own, written down and tested. Here's the full sequence, start to finish:
- Define the market and the buyer. Name one buyer segment and the job they are hiring for. A map drawn for "everyone" shows nothing useful.
- List the real alternatives. Include named competitors, plus doing nothing, doing it in-house and the generalist supplier buyers already use.
- Choose two axes buyers care about. Pick two attributes buyers actually use to choose, taken from sales calls, lost-deal notes and reviews. Each axis should split the market, and the two should not measure the same thing.
- Plot each alternative from evidence. Place each one using pricing pages, product pages, reviews and what buyers told you. Note the source and date beside each point.
- Read the gaps. Mark crowded areas, empty areas, and empty areas that are empty for a reason. Test any gap against buyer demand before treating it as an opportunity.
- Turn it into a decision. Choose the position you can prove and deliver, write it as a positioning statement, and test it with buyers.
Write the chosen position with our positioning statement template, then follow the rollout steps in B2B positioning for established companies. If you're choosing between buyer groups at the same time, the STP guide for B2B covers the segmentation and targeting side.
If your team still argues about who the competition is, this earlier episode is worth twenty minutes together. The clip starts where Dunford explains how to discover who your real competitors are, and then moves on to what she calls the question all customers ask.
Common Mistakes With Positioning Maps
The same handful of errors turn up again and again. Most of them come from drawing the map to confirm a plan that's already been made.
- Axes chosen to make you win. If you sit alone in the top-right corner on axes you invented, the map is flattering you.
- Only named competitors. Leaving out "do nothing" and "do it in-house" hides the alternative you lose to most.
- Plotting from memory. A point without a source and a date can't be checked next quarter.
- One map for every buyer. A finance director and an operations lead may sort the market on different axes. Draw one map per segment.
- Mistaking a gap for demand. Empty doesn't mean wanted. Test it.
- Drawing it once. Competitors reprice and reposition. Redraw when something moves.
Template
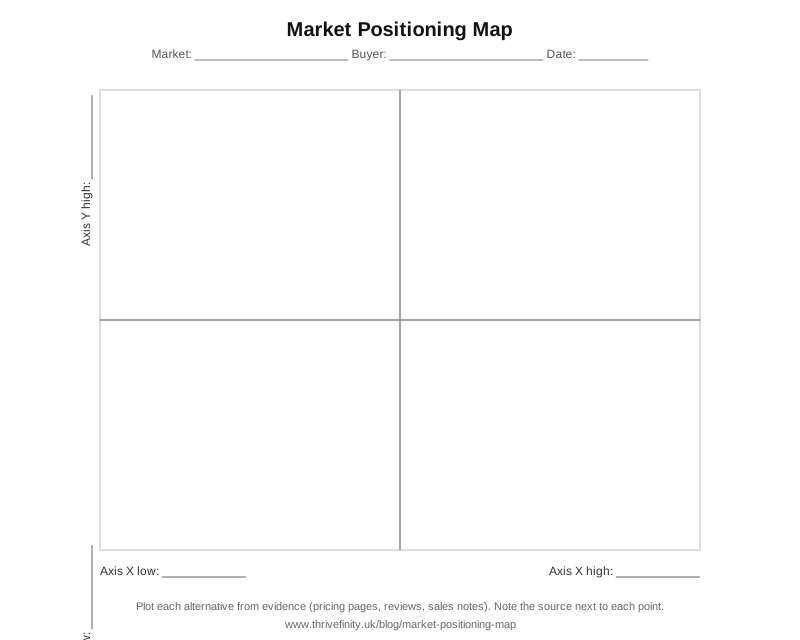
Download the blank positioning map template (SVG), print it or open it in any design tool, and fill in the market, the buyer, the axes and a source for every point. If you'd rather score your positioning first, the free Positioning Probe worksheet walks through market, buyers, competitors and trends and shows you your weakest angle.
Where ThriveFinity Fits
Most teams can draw a decent first map themselves in an afternoon, and I'd encourage it. Where we help is when a decision rides on what the map shows.
- Decision Brief (£749 + applicable taxes, 48-hour target): one positioning or targeting decision, tested against market, buyer, competitor and trend evidence, with a signed seven-block Decision Card and a 90-day plan. Good when you've found a gap and want it checked before you commit. The Decision Brief page has the full scope.
- Go-to-Market Build (£3,999 + applicable taxes): when the position is chosen and you need the positioning, a 5-page site, a 20-slide sales deck and a 3-email sequence rebuilt on the same evidence. The anonymised Go-to-Market Build sample shows a real positioning gap found from evidence, and the Go-to-Market Build page lists everything included.
We're not the right choice if you want a brand identity, a logo or a long creative process, or if you need months of hands-on marketing leadership. A fractional CMO or a brand agency fits those better. And if you haven't yet spoken to ten buyers about how they choose, do that first. No outside view replaces it.
❓ Common Questions
What is a market positioning map?
What is market positioning?
What is the difference between a perceptual map and a positioning map?
How do you choose the axes for a positioning map?
What is market mapping?
What are the benefits of a positioning map?
Does an empty space on the map mean an opportunity?
Can I publish a positioning map that names competitors?
What are the four types of differentiation?
How often should we redraw the map?
Sources
- April Dunford. aprildunford.com, definition of positioning. Checked 10 October 2026.
- 6sense. The B2B Buyer Experience Report for 2025 (survey of just under 4,000 B2B buyers). 2025.
- Gartner. Gartner Sales Survey Finds 61% of B2B Buyers Prefer a Rep-Free Buying Experience (632 buyers, August to September 2024). 25 June 2025.
- Eric Almquist, Jamie Cleghorn and Lori Sherer. The B2B Elements of Value. Harvard Business Review, March 2018.
- GOV.UK. Get information about a company (Companies House). Checked 10 October 2026.
- Internet Archive. Wayback Machine general information. Checked 10 October 2026.
- ASA and CAP. CAP Code section 3: misleading advertising, rules 3.33 and 3.34. Checked 10 October 2026.
- April Dunford. Competition in a Positioning Exercise. YouTube, 19 February 2026.
- April Dunford. Understanding the Distinction Between Competitors and Competing Alternatives. YouTube, 8 June 2023.